San Jose Unveils Interactive Online Map Of City Showing Gang Violence 'Hot Spots'
SAN JOSE (KPIX 5) -- The city of San Jose is unveiling a new first of its kind tool for predicting youth and gang violence in specific neighborhoods.
It's an interactive map that's loaded with information, showing hot spots and potential hot spots so the city can target those areas with resources.
"You can see how these things work over time, how they shift back and forth or up and down," said Director of Parks, Recreation and Neighborhood Services Jon Cicirelli.
The city calls it the Violence Risk Factors Map. It is a color-coded layout of all the census tracts in San Jose. Green areas show low-risk factors, while yellow areas are cautionary and red shows potential trouble spots.
But it's not just a crime map. It combines all factors from gang activity and dropout rates to poverty, child abuse and even the number of places to buy healthy food.
"There is so much more that really influences a neighborhood that makes it the fertile ground for crime to occur. And it's really those other influences that make the difference if you truly want to transform a neighborhood in the future," Cicirelli said.
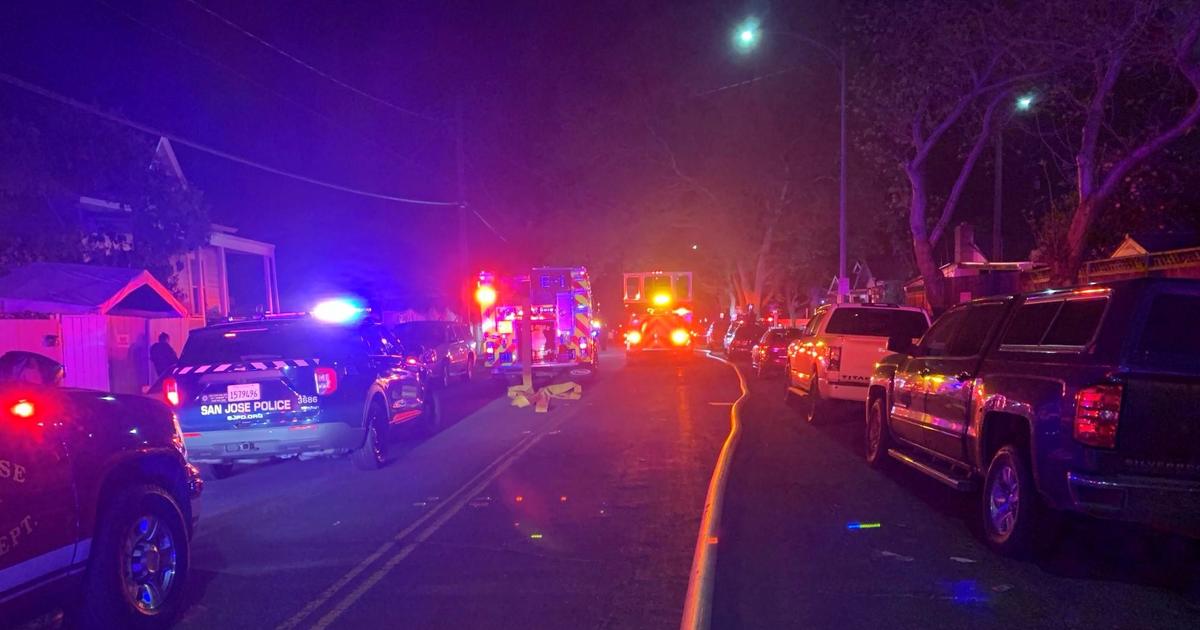
One area, the Cadillac/Winchester neighborhood on the city's west side, has been the scene of two fatal shootings this year.
Neighbors worry about the heavy influence of gangs since most parents work two jobs just to survive.
"The kid is by himself or herself and the recruitment is starting now," said Helen Garcia, who lives in the neighborhood. "It's scaring us because how are we supposed to survive while keeping our kids safe from the
gangs?"
When you click on that neighborhood, it brought up loads of information showing it is in the 99th percentile for gang activity. But it's also in the near 90th percentile for community disorganization and child maltreatment.
"It's not so much to try to say this neighborhood is good, or this neighborhood is bad. It's more to help us understand where resources are needed going forward. You'd be surprised how many neighborhoods just need a little coaching to access the system," Cicirelli said.
The city is now focusing resources in Cadillac/Winchester with an initiative called Project Hope.
The data behind the map is strong enough to go back in time to show how things were, as well as look ahead to the future as improvements are made.
The Violence Risk Factors Map can be found on the city's website.